KPI · 2023
Monitoring stack
A central observability stack for metrics, logs and alerts across KPI's infrastructure and applications.
100%
What I built
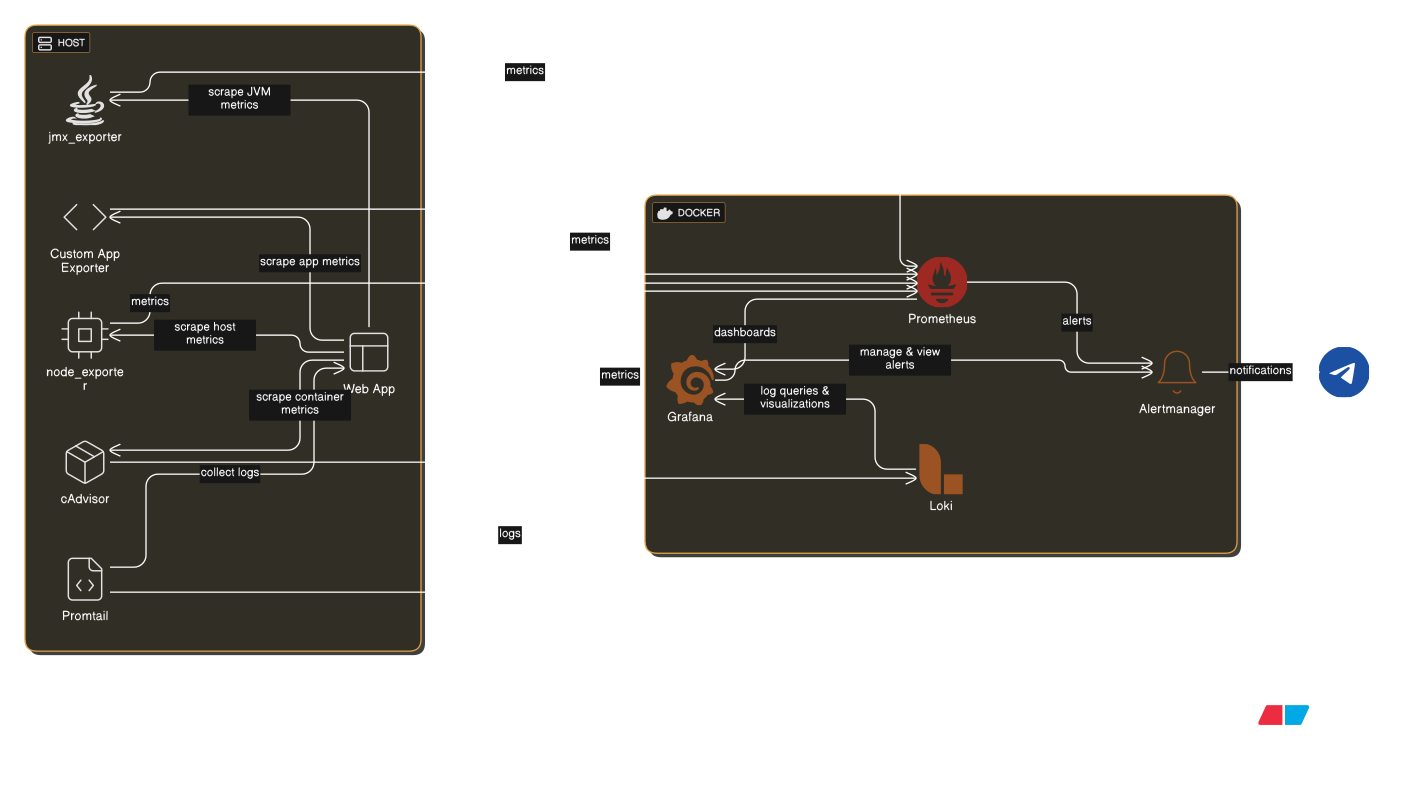
- Prometheus collects metrics from node_exporter (system), jmx_exporter (Java), cAdvisor (containers) and a custom exporter for application metrics.
- Grafana dashboards cover infrastructure health, application performance and business metrics.
- Loki aggregates logs from every service, with Promtail collecting and forwarding them.
- Alertmanager routes and deduplicates alerts and sends critical ones to Telegram.
- The whole stack runs in containers and is built for high availability.